
Hardiness zones maps are critical tool for gardeners. Without that crucial piece of information, it would be difficult to know if the climate is warm enough to support a bird of paradise or colocasia, or if winter chill will provide a period of dormancy required by tulips, apples, peonies or lilacs.
Zone maps look complicated, but they’re really pretty simple once you figure out how they work. If hardiness zone maps have you confused, read on.
Understanding Hardiness Zone Maps
In the United States, hardiness zone maps were initially developed by the U.S. Department of Agriculture in the 1920s and 30s, although maps weren’t published until 1960. The map has been overhauled several times over the years and is updated periodically to reflect updated weather data and climate change. Similar maps have been developed in countries around the world.
United States
USDA maps are divided into thirteen color-coded hardiness zones based on average winter lows. Each zone is 10 degrees warmer than the preceding zone. If a plant label or online planting information indicates a plant will tolerate Zone 5, it is liable to freeze and die in Zones 4 and below. Many USDA maps are even more specific, dividing zones into subzones designated as a and b.
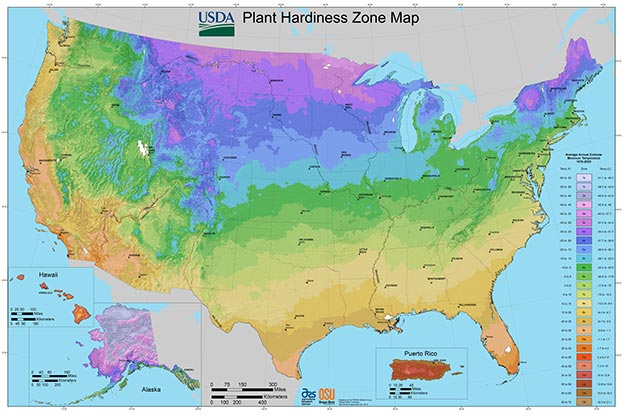
http://planthardiness.ars.usda.gov/phzmweb/downloads.aspx
Canada
Agricultural Canada created a hardiness map in 1967. The map is more extensive than the USDA map and considers length of frost-free days, summer rainfall, snow cover, maximum wind speed, maximum temperature and other variables.
The map is based on nine zones, which, like the USDA map, are color-coded and divided into subzones. Natural Resources Canada (NRC) has updated the map to reflect climate change and other relevant data, especially in Western Canada. Canadian gardeners can also refer to a simpler map based on the American hardiness zone system
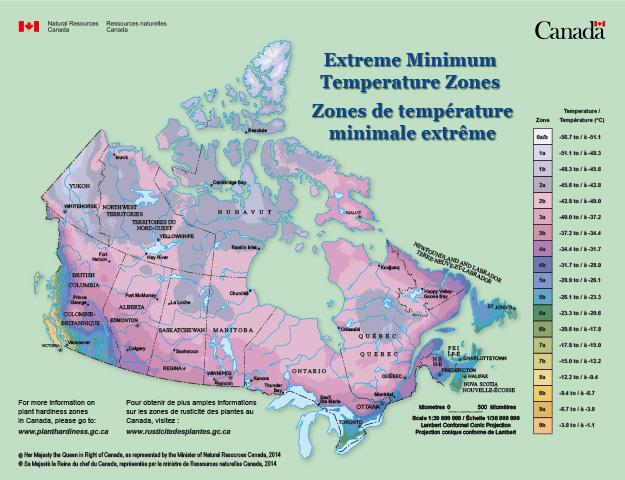
Canada’s plant hardiness zone maps and website get an update
Hardiness Maps: Helpful but Imperfect
Hardiness maps provide valuable information but shouldn’t be taken as gospel truth. For example, factors such as soil drainage, air quality, elevation, soil nutrients, snow cover, wind chill, humidity and nighttime temperatures can all affect plant health.
Periods of unusually extreme heat or cold can also skew historical data. Often, micro-climates can exist within a zone – or even within a single garden.
It’s important to keep in mind that the USDA map is based on historical winter temperatures and not overall climates, which can vary widely. For example, Seattle’s marine climate is in the same hardiness zone as parts of Arizona and Georgia, but growing plants in those climates is very different.
Use hardiness maps as general (and very useful) information, but ultimately, let experience be your guide. In time, you’ll grow to understand your particular climate conditions and how they are reflected in the hardiness maps.


